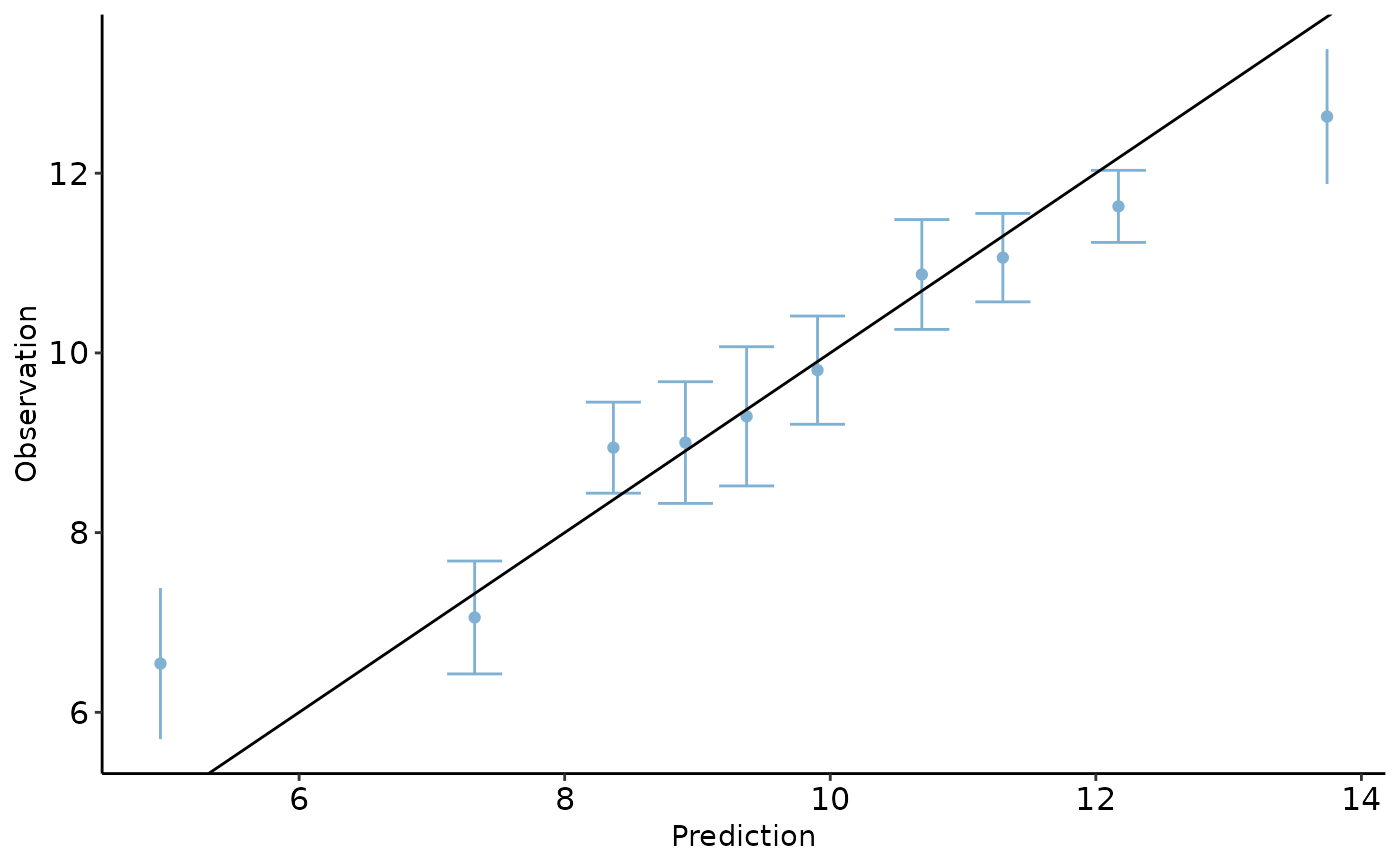
Title Create calibration plot based on observed and predicted outcomes.
Source:R/calibPlot.R
calibration_plot.RdTitle Create calibration plot based on observed and predicted outcomes.
calibration_plot(
  data,
  obs,
  follow_up = NULL,
  pred,
  group = NULL,
  nTiles = 10,
  legendPosition = "right",
  title = NULL,
  x_lim = NULL,
  y_lim = NULL,
  xlab = "Prediction",
  ylab = "Observation",
  points_col_list = NULL,
  data_summary = FALSE
)
Arguments
- data
Data include observed and predicted outcomes.
- obs
Name of observed outcome in the input data.
- follow_up
Name of follow-up time (if applicable) in the input data.
- pred
Name of first predicted outcome in the input data.
- group
Name of grouping column (if applicable) in the input data.
- nTiles
Number of tiles (e.g., 10 for deciles) in the calibration plot.
- legendPosition
Legend position on the calibration plot.
- title
Title on the calibration plot.
- x_lim
Limits of x-axis on the calibration plot.
- y_lim
Limits of y-axis on the calibration plot.
- xlab
Label of x-axis on the calibration plot.
- ylab
Label of y-axis on the calibration plot.
- points_col_list
Points' color on the calibration plot.
- data_summary
Logical indicates whether a summary of the predicted and observed outcomes. needs to be included in the output.
Value
Returns calibration plot (a ggplot object) and a dataset including summary statistics of the predicted and observed outcomes (if data_summary set to be TRUE).
Examples
library(predtools)
library(dplyr)
#>
#> Attaching package: ‘dplyr’
#> The following objects are masked from ‘package:stats’:
#>
#>     filter, lag
#> The following objects are masked from ‘package:base’:
#>
#>     intersect, setdiff, setequal, union
x <- rnorm(100, 10, 2)
y <- x + rnorm(100,0, 1)
data <- data.frame(x, y)
calibration_plot(data, obs = "x", pred = "y")
#> $calibration_plot

#>
#>